SEE WHAT IS HAPPENING NOW
By the time a weekly report shows a problem, you have lost weeks you cannot get back. A 30-day-old claim is normal. A 90-day claim is a problem. A 180-day claim with no documented follow-up is likely to settle for less, get written off, or disappear entirely.
It reflects:

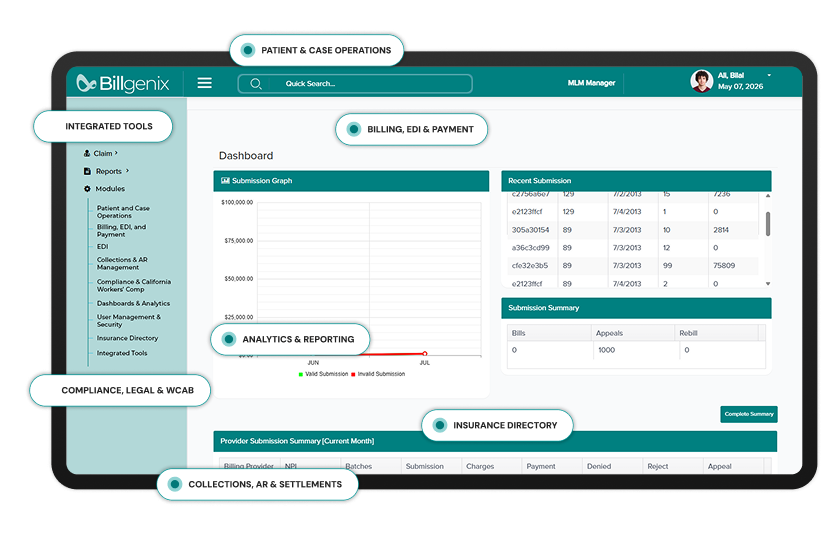
DASHBOARDS THAT REFLECT LIVE ACTIVITY
A standard aging report shows you how old a claim is. BillGenix shows you how old it is, what payer it is with, what the last EDI response was, what denial category it falls into, and whether the IBR or SBR window is still open.
 clinics tracking claim risk in real time
Integrations
Billgenix dashboards consolidate billing, EDI, collections, and compliance activity from every connected source into one view. Need custom reports? We can build them.
Explore Integrations


Segment AR by payer, adjuster, claim stage, and last activity date. Active denial workflows separated from no-response claims.
Spot systemic denial patterns the day they emerge, not at a quarterly review. Filter by reason category and date range.
Real-time rejection rate by clearinghouse and payer with reason code distribution across the portfolio.
Track billed versus OMFS-expected versus paid amounts across the portfolio. Underpayment patterns aggregated by payer.
Tailored views for billers, collectors, compliance officers, and executives. Each role sees what matters for their decisions.
Every action time-stamped and tied to a user, available without manual reconstruction.


AR visibility improved because status is tied to real activity. We can see what has been submitted, responded to, followed up on, or escalated without chasing internal updates.

SEE PROBLEMS WHEN THEY EMERGE
A spike in CPT denials. A clearinghouse rejection trend. An OMFS underpayment cluster. When dashboards reflect what is happening now, intervention happens before the problem compounds.

Customer Support
Reports do not interpret themselves. Get help from analysts who understand California work comp metrics and what they actually mean.
ACCELERATE THE REVENUE CYCLE
When dashboards update in real time, every billing manager, collector, and compliance officer makes the next decision with current information. The revenue cycle moves faster.
Request a reporting review with a California work comp operations specialist.
Request a Reporting Review